
 Scan With Phone's Bar Code Reader
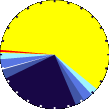
|
|
| Radar Images Courtesy of Radar Monster and GEOCOLOR Satellite Images Courtesy of NESDIS. | |
|
METRIC |
IMPERIAL
|
Updated: 24-Apr-2024 @ 3:02 PM | |||||||||||||||||||||||||||||||||||||||||||||||||||||||||||||||||||||
| Temperature | Current Conditions4 | Forecast / 2 Hr. Lightning | ||||||||||||||||||||||||||||||||||||||||||||||||||||||||||||||||||||
|
|
|
||||||||||||||||||||||||||||||||||||||||||||||||||||||||||||||||||||
| Dew Point | Liquid Precipitation | Wind Speed | Sun/Moon | |||||||||||||||||||||||||||||||||||||||||||||||||||||||||||||||||||
|
|
|
|
|||||||||||||||||||||||||||||||||||||||||||||||||||||||||||||||||||
| Humidity | Barometer | |||||||||||||||||||||||||||||||||||||||||||||||||||||||||||||||||||||
|
|
|||||||||||||||||||||||||||||||||||||||||||||||||||||||||||||||||||||
| Cooling Degree Days | WebCam Thumbnails | Heat Index | Air | |||||||||||||||||||||||||||||||||||||||||||||||||||||||||||||||||||
|
|
|
|
|||||||||||||||||||||||||||||||||||||||||||||||||||||||||||||||||||
| Current UV Index | Current Solar Energy9 | |||||||||||||||||||||||||||||||||||||||||||||||||||||||||||||||||||||
|
|
|||||||||||||||||||||||||||||||||||||||||||||||||||||||||||||||||||||
| SE Lincoln WX Almanac | Irrig. Index5 | Station All Time Records | Cloud Level | |||||||||||||||||||||||||||||||||||||||||||||||||||||||||||||||||||
|
|
|
|
|||||||||||||||||||||||||||||||||||||||||||||||||||||||||||||||||||
|
METRIC |
IMPERIAL
|
Updated: 24-Apr-2024 @ 3:02 PM | |||||||||||||||||||||||||||||||||||||||||||||||||||||||||||||||||||||


| 1 Rain season: Jan 1st to Dec 31st. 4 Chandler Burning Index (CBI) Updates Continuously. 5 Estimated amount of water needed to replace the water used by plants and evaporation from the past week. (Negative numbers mean amount of water needed, positive numbers mean excess water is present). 6 Air Quality Index is provided by Douglas County Health Department in Omaha, NE. AQI Data for Lincoln, NE is currently unavailable as an RSS feed.. 9 Solar Index represents either an absolute scale of solar energy (W/m²) using the station’s recorded maximum or a percentage of computed theoretical solar maximum using the station’s location and time of day. These indices differ most when the sun is low on the horizon. The current scale is shown, and will toggle if it or the icon is clicked. 10 Historical average only to day 24 of just the month of April for this station since 2008. 11 Historical average rain this season to day 24 of April for this station since 2008. |
| NWS Weather Forecast - Outlook Today & Tonight | ||||||||||||||
|
||||||||||||||
|
||||||||||||||
|
||||||||||||||
|
Season Countdown Timer by Curly Precipitation average-to-date script courtesy of Murry Conarroe ajax-dashboard.php - Version 1.32 - 18-Jan-2023 - Multilingual - Script by: Scott of BurnsvilleWeatherLIVE.com Now supported by Saratoga-weather.org Download |
||||||||||||||


